🖼️ Art Connect — A New Approach to Data for Art Institutes
Contributors: Oviya Adhan, , Jordan Andersen, Tiffany Liu, Helin Yilmaz
Premise:
The Metropolitan Museum of Art (The Met) has long served as a cultural hub for both in-person and online audiences. As digital experiences become more integral to how we explore and learn about art, The Met has a powerful opportunity to modernize its infrastructure and engage visitors in new ways.
Our project aims to explore the 470,000 artworks in its collection — each tied to artists, eras, departments, and cultures — to uncover hidden relationships across the museum’s holdings. In the future, this data can hopefully:
Power a recommendation engine for on-site and virtual visitors
Reveal hidden connections across time periods, departments, and artists for educational exploration
Improve content delivery performance across The Met’s digital platforms
Inspire curators with new exhibition ideas and support art history research using the existing collection
We believe these goals will transform the museum experience into a web of cultural storytelling and global access.
However, the highly interconnected nature of the data poses a challenge for traditional relational databases. To address this, we explored a modern NoSQL architecture — specifically Neo4j (graph), MongoDB (document), and Redis (in-memory key-value) — to better model, analyze, and serve these rich cultural connections.
The Data:
As a proof of concept (POC), we explored The Metropolitan Museum of Art’s open access dataset which provides information on the artist, creation timeline, accession, and collection categories of over 470,000 artworks in their collection. For the POC, we specifically focused on the collection’s paintings to manage our limited, pre-production compute power. As for the concepts, we functionally explored how graph, document, and in-memory key-value databases can address our use cases, while only sandboxing graph databases since it covered the majority of our use cases on its own.
Once we set these boundaries, the team began transforming the raw collection data into a structure optimized for a graph database. This involved carefully identifying the key entities (nodes) that would anchor the network, and the relationships that would meaningfully connect them. We chose four main node types to reflect the dimensions most relevant to The Met’s digital and curatorial goals:
:Artwork — each painting in the collection becomes a distinct node, serving as the focal point of analysis.
:Artist — representing the creator(s) of each artwork, allowing us to trace individual styles and influences.
:Department — corresponding to the museum’s internal organization (e.g., European Paintings, Asian Art), useful for exhibit design and content delivery.
:TimePeriod — grouping artworks by historical context, using centuries as a broad temporal lens.
Next, we defined the relationships (edges) to capture how these entities are linked:
(:Artwork)-[:CREATED_BY]->(:Artist) — indicates the artist responsible for the painting. This relationship enables queries like “show all works by this artist” or traversal to related artists via shared periods or styles.
(:Artwork)-[:BELONGS_TO]->(:Department) — reflects which museum department the artwork is housed in. This is essential for logistical insight, filtering, and building department-specific recommendations or visualizations.
(:Artwork)-[:ASSOCIATED_WITH]->(:TimePeriod) — connects each painting to the time period it was created in (e.g., 19th century), allowing users to explore works within a historical context or identify temporal trends.
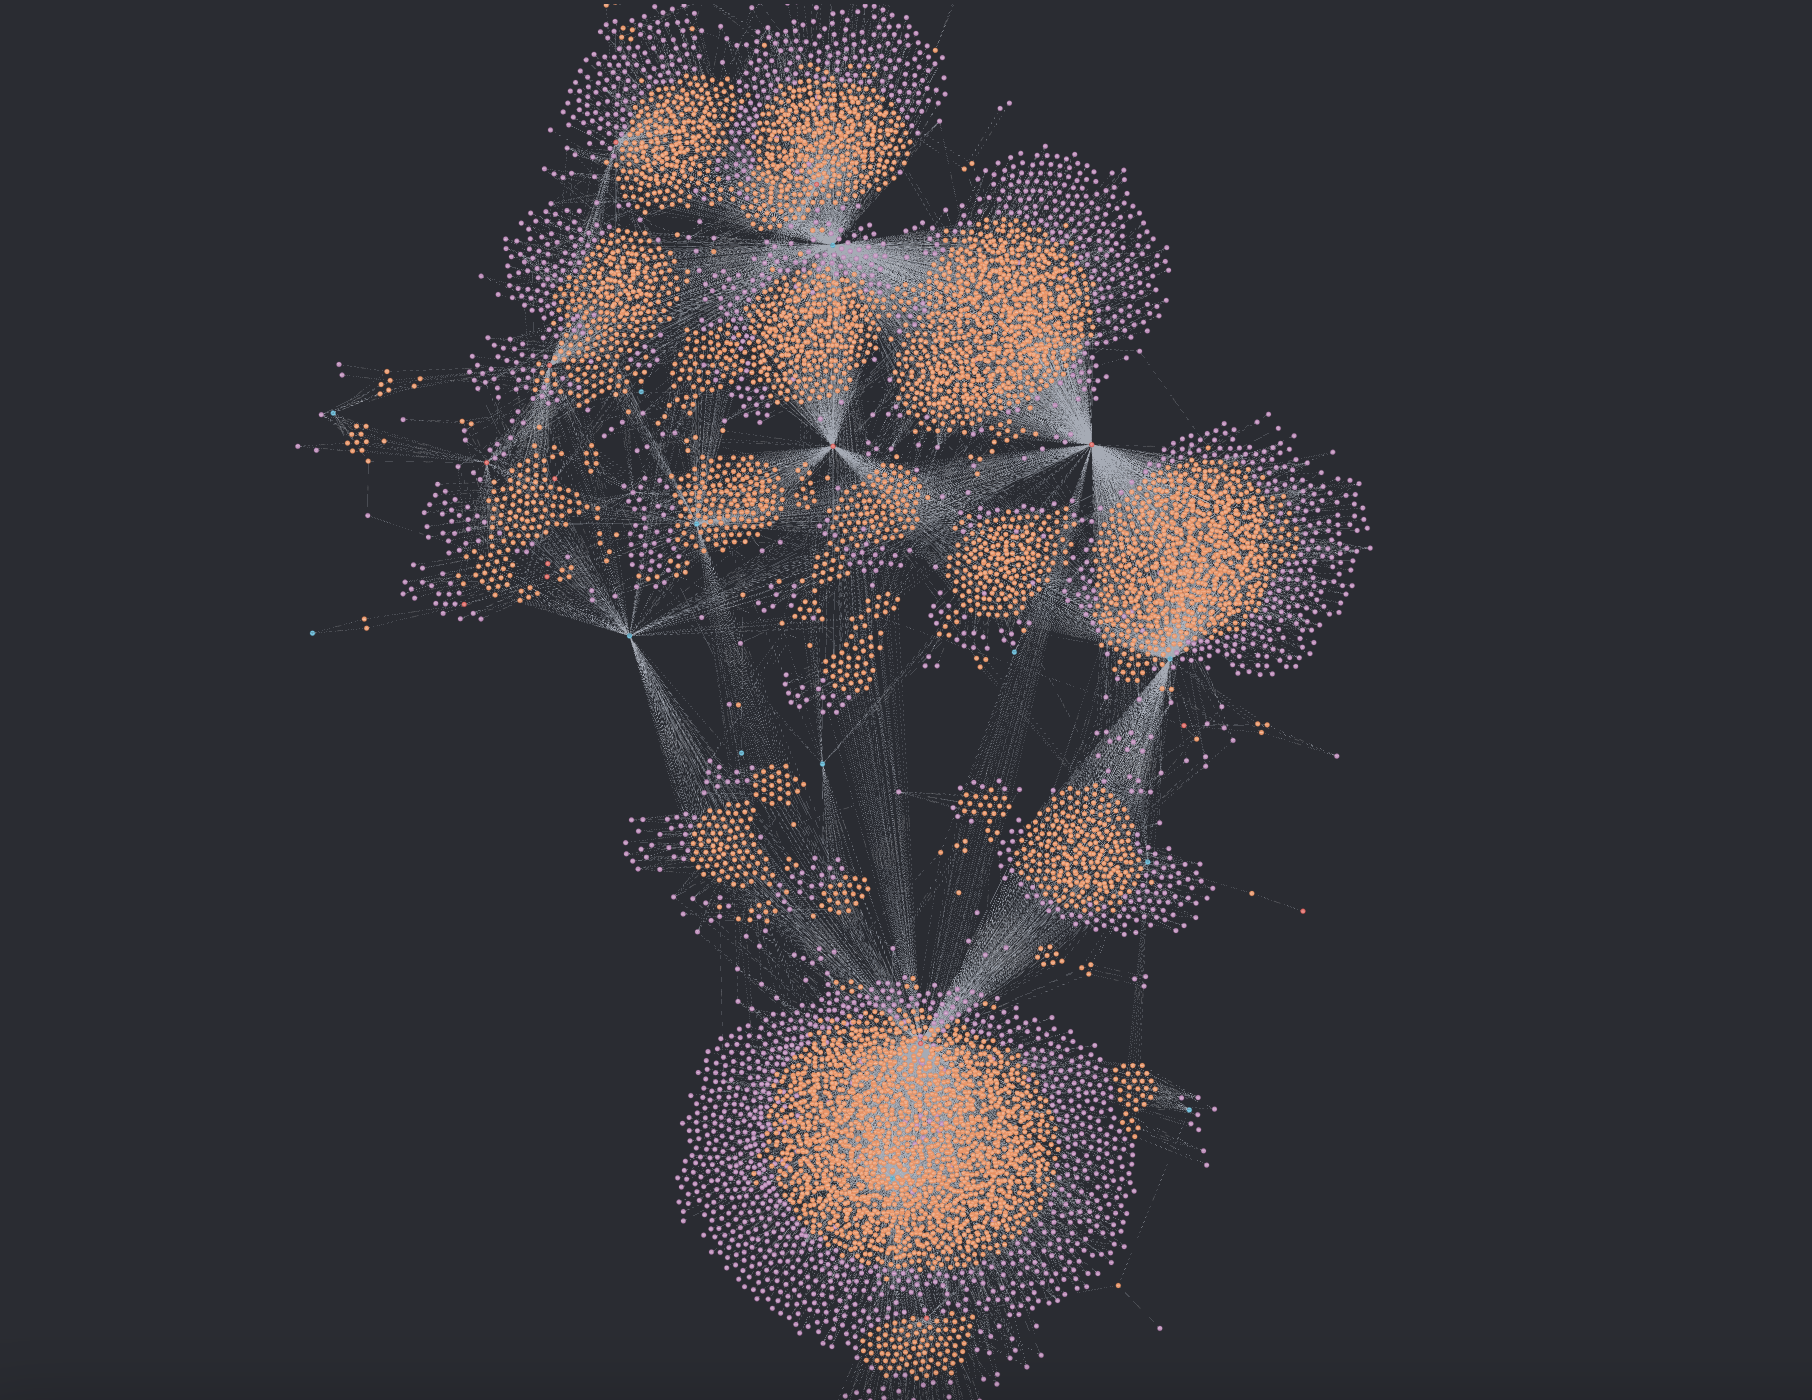
These relationships form the basis for rich, multi-hop queries — such as surfacing artworks created by artists from the same era, or building visitor pathways across departments that share stylistic or historical ties. The resulting graph structure allows The Met to uncover hidden connections and power flexible, real-time recommendation systems that would be difficult to implement using traditional relational databases. This is our resulting structure:
Solutions:
1) GRAPH DATABASE (Neo4j)
Overview
Neo4j:
Is a NoSQL graph database
Uses Cypher as the query language
The advantages of using a graph database over a relational database:
Good for nodular data with complex relationships
Can run graph algorithms to explore these complex relationships
More easily scalable for complex datasets
Use Cases
1) Louvain Modularity Algorithm
One of the most valuable algorithms we used was Louvain Modularity, which identifies tightly connected communities within large graphs. After modeling artists and artworks by their shared attributes, we ran the Louvain algorithm and discovered 9 distinct artist communities with a modularity score of 0.61 — indicating strong internal cohesiveness. We visualized this in a bar chart (Chart 1), where each community’s diversity is represented by the number of time periods (blue) and departments (orange) it spans.

These communities weren’t just mathematical clusters — they revealed hidden stories across cultures and eras. For instance, one community contained over 1,800 artworks from the 20th century, suggesting that time played a key role in its formation. Others were more strongly shaped by departmental focus, like Modern and Contemporary Art or European Paintings.
To dive deeper, we created two heatmaps: one mapping the number of artworks per time period in each community, and the other mapping artworks by department.

Redis:
Is a NoSQL in-memory, key-value database
The advantages of using a in-memory, key value database over a relational database:
Quick queries, ideal for immediate, real-time transactions
Another database we considered with our work with The Met is Redis, which is an in-memory, key-value database. Our idea for incorporating Redis into our museum data engineering stack is to have a real-time, mobile recommendation system to create a more interactive and customized visitor experience.
This recommendation system would work using two aspects. Visitors will favorite artworks in the collection on the mobile app prior to or during their visit. Visitors can also choose to allow the app to access their live location during their visit. Then using both or either the visitor’s favorite artworks and/or live location within the museum, the app will return a recommended list of artworks that it thinks the visitor will enjoy while also considering which artworks are currently on view and are in nearby galleries relative to where the visitor is located in the museum at that moment.
The reason why we wouldn’t use a relational database for this is that a real-time system requires immediate access to subsets of the database to be able provide dynamic updates as needed, which an in-memory database is much better suited to achieve over a relational database.
Takeaway:
For centuries museums have grounded cultural discussion by studying, interpreting, and showcasing artifacts and art. With this plethora of information comes massive amounts of data that can be used to elevate a museum’s goals, whether that’s through research or exhibitions. This can be achieved by going beyond traditional relational databases and exploring how graph, document, and in-memory databases can be implemented to extend their data pipeline. While it might be a worthwhile investment, each institute will need to assess their own database needs depending on their research and engagement goals.
Check out the work behind this project at https://github.com/oadhan/MetMuseum-Data-Engineering-POC
Citations:

(2) Closeness Centrality Algorithm
Another graph algorithm we considered is closeness centrality, which calculates the average shortest path length from a node to all other nodes in the network. The higher the score, the more central the node is. By modeling each department at The Met based on their collection of paintings, we were able to identify the most centralized art departments.
Closeness centrality by department can be applied in two ways at The Met. The first is to identify cross-departmental relationships, and in turn hopefully cross-cultural relationships, to spark novel art history research ideas. The second is to prompt collaboration across departments for exhibits that showcase the overlapping aspects of their collections.
Below you can find a bar chart of the closeness centrality results. By looking at the closeness centrality of The Met departments’ paintings, we can get insights on cultural representation and department robustness through this metric. With the highest scoring three departments being European Paintings, Modern and Contemporary Art, and The American Wing, there is clearly more “western” or “global north” representation among artworks within the collection which is not entirely surprising considering The Met is located in the United States. This ranking can also help us identify which departments have more robust collections to pull from for various research opportunities or future exhibitions.

(3) PageRank Algorithm
Pagerank is an algorithm useful for finding the most influential nodes within a graph. It scores each node based on its incoming relationships and the weight of those relationships. After scoring a node, it then passes that score to the outgoing relationship. The score is iteratively distributed this way, and the process continues until the scores converge, or a predetermined number of iterations is met.
We used this algorithm to get a working knowledge of which artists are already the most influential within the Met’s collection, suggesting a high number of artworks produced by that artist and spread across departments. Once we had PageRank scores for each artist, we paired them with their active years to explore influence across different centuries.
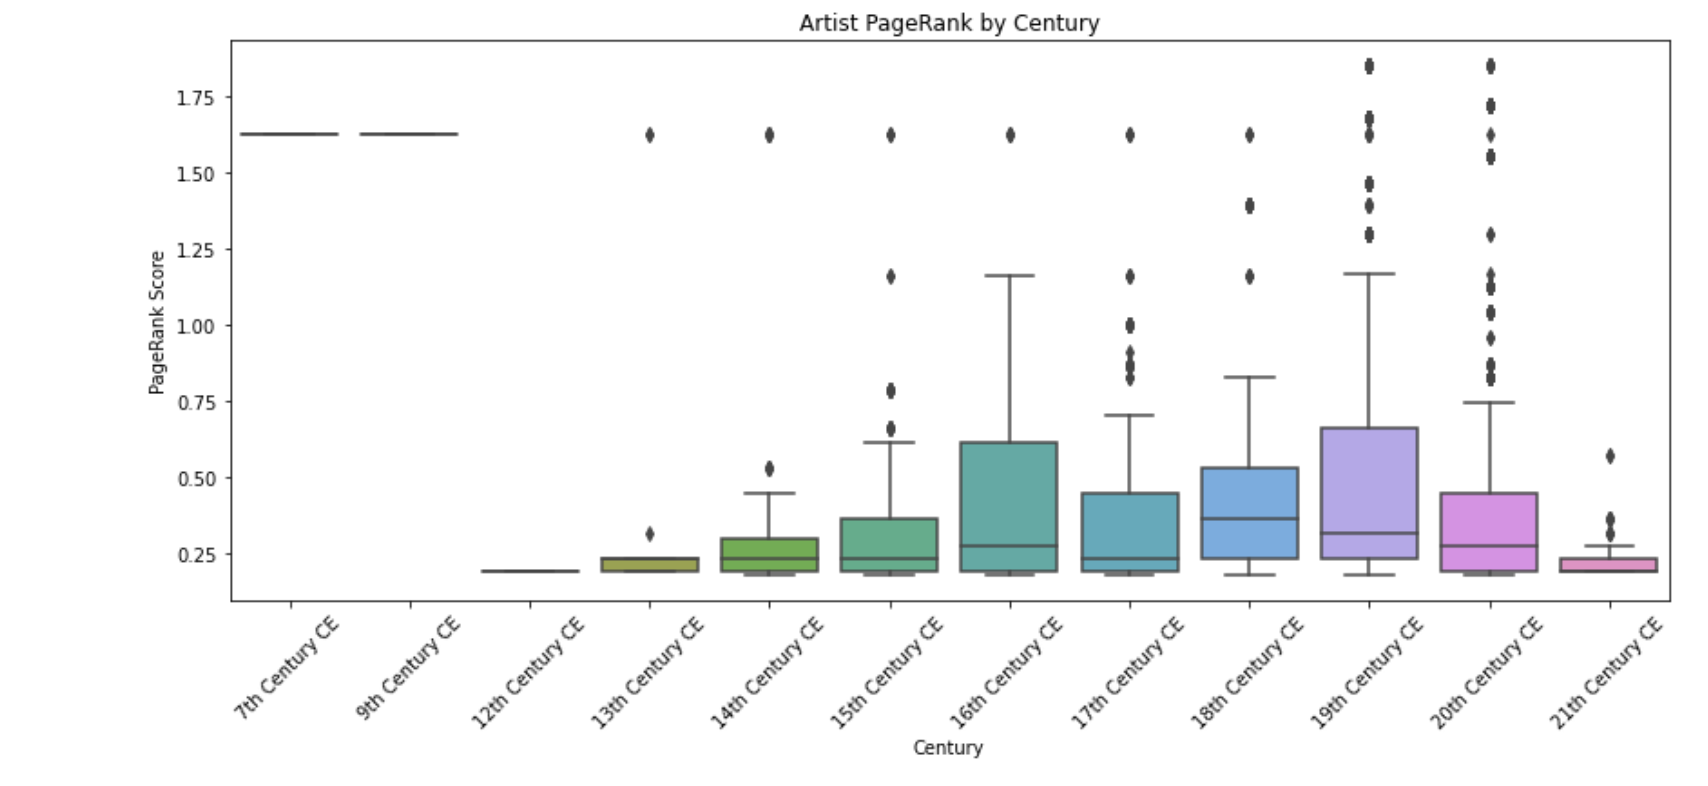
Below is a box plot representing the distribution of the scores of artists across centuries. We found that the 18th century, while not the most populated in terms of artists, had the highest average influence scores, likely due to major movements like Impressionism and Romanticism. With this insight, the Met could strategically add works from lesser-known artists of that era to enrich and diversify their collection. Meanwhile, the 16th, 19th, and 20th centuries had more artists, but generally lower average influence. For these time periods, a useful strategy might be to deepen existing collections and acquire more works from already represented artists to build momentum around visitor favorites and known names.
2) Document Database (MongoDB)
Overview
MongoDB:
Is a NoSQL document database
The advantages of using a document database over a relational database:
Good for storing information in document form
More flexible format storage
Easier to present data in different points of view (ie. customers, sales, products, etc.)
Use Cases
Beyond the collection itself, understanding visitors’ preferences for artwork, artists, and departments within the Met would allow the museum to build exhibits that resonate with their target audience. One way to accomplish this type of “point-of-view” analysis is through adding MongoDB into the museum’s data engineering strategy to provide a flexible reference for future data analytics.
If visitors were able to complete a quick survey at the end of each visit, sharing their favorite departments, artworks, and artists from their experience that day or in general, the data team could use MongoDB to store this survey data and conduct point-of-view analytics. MongoDB would allow the flexibility to query by artist, time period, department, or even specific exhibitions, enabling the museum to curate new artwork and exhibitions that resonate with visitor experiences. Over time, this would help the museum to tailor exhibits in a way that reflects real visitor interests in a data driven way.
3) In-Memory, Key-Value Database (Redis)
Overview
Use Cases

(1) The Metropolitan Museum of Art. (n.d.). The Metropolitan Museum of Art Open Access. GitHub. https://github.com/metmuseum/openaccess