📚 Determining High School Admissions from Middle School Factors
Contributor(s): Oviya Adhan
Premise:
Every year, middle school students around New York, NY apply to the High School for Health Professions and Human Services (HSPHS). This project explores HSPHS admissions data through correlation analysis and machine learning to uncover the factors that are most strongly associated with acceptance. By understanding which factors best predict an applicant’s admission, this analysis aims to provide actionable insights to middle schools, helping educators understand how to better position their students for admission to HSPHS.
Methodology:
Through correlation analysis and two Multiple Linear Regression Models, I aimed to find the factors that are most strongly associated with acceptance and general student performance. The process included:
Data Pre-Processing – Loaded and split data into input X (applications) and output Y (admissions) groups
Exploratory Data Visualization –
Compared correlation between various predictor variables:
Student perception factors (strong community ties, school leadership efficacy, teacher collaboration, instruction rigor, trust, and support) + School performance factors (reading score, math score, and student achievement levels)
Per-student spending + HSPHS acceptances
Applications + HSPHS acceptances
Identify schools with the most admissions to HSPHS
Model Development – Using SciKit Learn’s linear regression model, I built two separate Multiple Regression models. The input variables included factors related to applications, socioeconomic factors, test scores, and school perception scores.
The first model’s actual output (Y1) = Acceptances
The second model’s actual output (Y2) = School Performance.
Model Decomposition - The models were then decomposed into their weights (coefficients) and bias (intercept) for feature analysis. The models were recomposed from these individual aspects to create the predictive function ( Ŷ ).
Model Evaluation – Using the predictive linear regression model, predictions were generated for each set of inputs. From there, the r-squared value was calculated to measure the proportion of the variation in the dependent variable (Y) that is predictable from the independent variables (X) based on their assigned weights in the model.
Tools: Python (Pandas, NumPy, SciKit Learn, Matplotlib)
Results:
Taking a look into the correlation analysis, you get a sense of what factors are most associated with higher admissions rates or school performance. First, taking a look at school performance (measured as a combination between reading score, math score, and student achievement levels), I took a look at its correlation with student perception factors (strong community ties, school leadership efficacy, teacher collaboration, instruction rigor, trust, and support). For this I found that r=0.42, which we can visualize in the Chart 1 below:

[Chart 1 - Student Perception v. School Performance]
As for HSPHS acceptances, I compared three predictor variables - number of applications, application rate, and per-pupil spending to see which factor may most heavily contribute to admissions success. With the number of admissions, I calculated the Pearson correlation coefficient (r) which came out to be 0.80, 0.66, and -0.40 for number of applications (Chart 2), application rate (Chart 3), and per-pupil spending (Chart 4) respectively, as visualized by the three charts below:
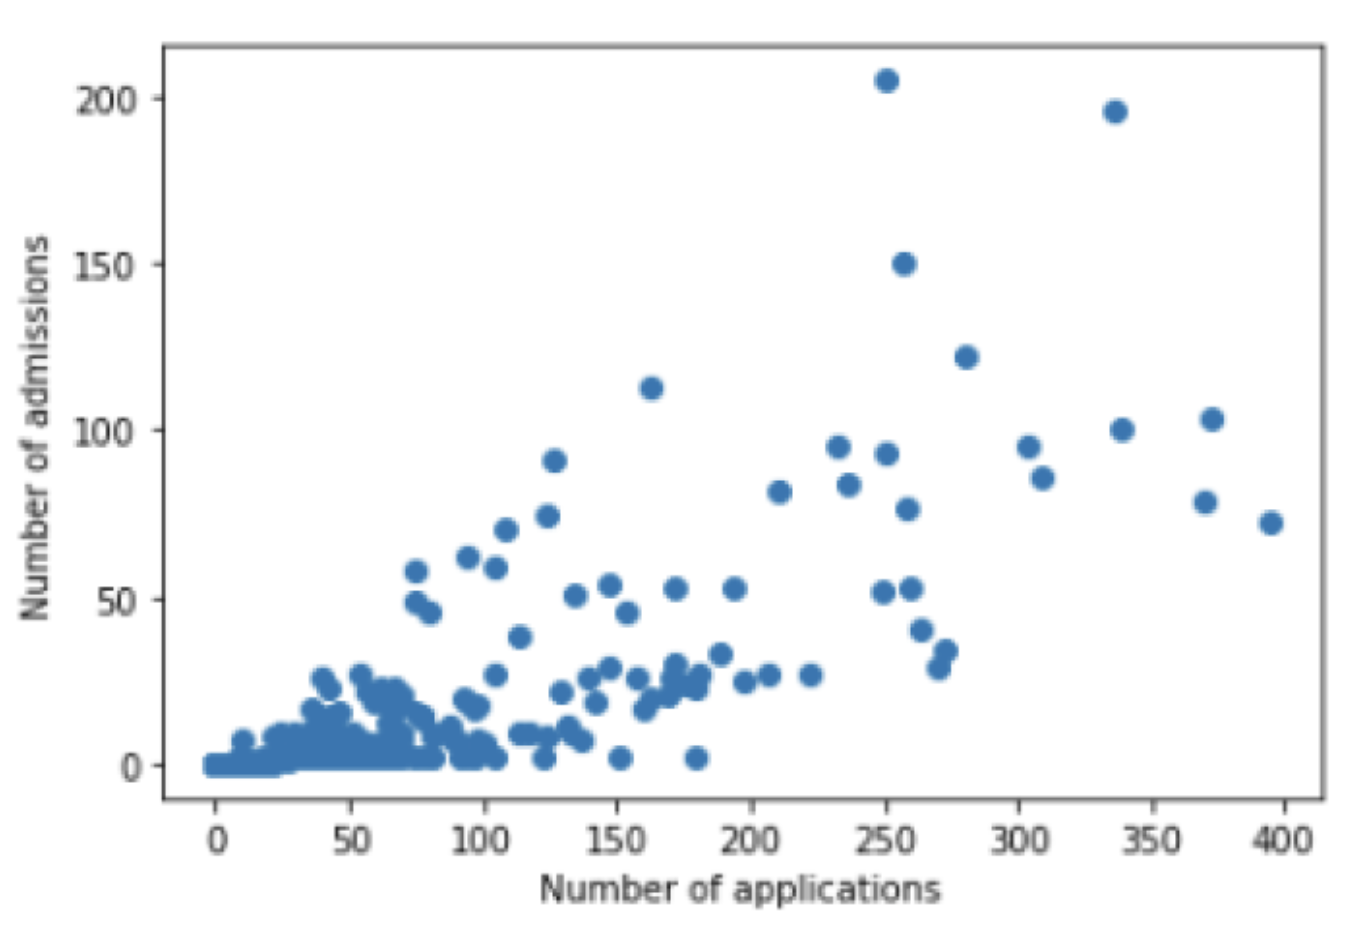


[Chart 2 - Number of Applications v. Number of Admissions]
[Chart 3 - Application Rate v. Number of Admissions]
[Chart 4 = Per-Pupil Spending v. Acceptance Rate]
The most relevant predictor for HSPHS admissions with the highest positive weight in the multiple regression model is the application rate, meaning that with an increased application rate, the admissions rate generally increases. As for the multiple regression model for overall school performance, the multi-factor variable of student perception helps the highest weight, which means that things like strong community ties, more teacher collaboration, and effective school leadership helps the most with student performance.
NOTE: We cannot reach conclusions from the weights in the model since the inputs are not standardized to be on the same scale. Therefore, variables with a smaller range may appear to have a more impactful prediction due to having a larger weight which may just be balancing that term out with the other larger terms in the input. Therefore, final recommendations below are based on the correlation analysis.
Recommendations:
There are three primary recommendations I have for the middle schools under the New York City Department of Education to increase their students’ chances of earning admission into the High School for Health Professions and Human Services (HSPHS) or generally increasing student performance:
Spread awareness of HSPHS - By spreading awareness, schools will likely increase their raw application numbers. The largest correlation with acceptances among all predictive factors is with applications, so generally if there are more applicants from a school, there will be a higher number of acceptances.
Strengthen school pride - Students’ perception of their school is moderately correlated with school performance. Since student perception combines multiple factors, focus on features that are easily adaptable such as bolstering collaboration amongst teachers and parents or hosting community-building events with students and their families.
Hire more teachers - By decreasing the student to teach ratio, students will receive more personalized attention which generally leads to better school performance. This depends on the school’s resources.
Limitations & Future Work:
Limited scope - The scope of this work is limited, only covering the analysis with a Multiple Linear Regression. With more time, I would have trained a couple of other types of models. In particular, I think a decision tree would work well with the mix of categorical and numerical predictors.
Non-standardized inputs - Since the inputs are not standardized, their weights cannot be directly compared as mentioned in the results section. If done again, I would standardize the variables to ensure they can be compared through their weight. I would choose this over normalization to account for possible outliers.
Single-year data - The data used only covers the admissions results to HSPHS in 2017, which was the latest data at the time of this project. If done again, I would hold the latest data as my test set while splitting the previous year’s data into an approximate 60 / 40 split between my training and validation sets.
Data not split - This is a huge miss of many in this process. At the time of publication (2018), my skills were less robust. Therefore, I missed out checking the performance of my model in depth, at minimum the accuracy and generalization capabilities of this model. To check out a more recent machine learning project of mine that thinks those things through, visit https://www.oviyaadhan.com/project-car-crash :)
Check out the work behind this project at https://github.com/oadhan/NYC-HS-Admissions-Predictors